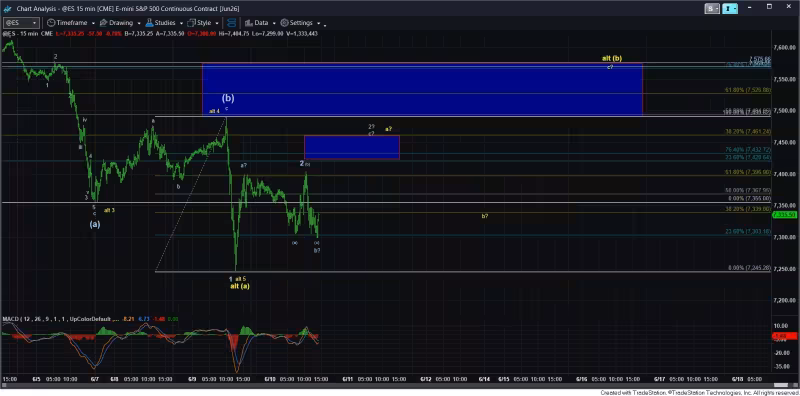
The analysis published June 10, 2026 concluded the S&P500 remains open to a broader wave 2 — or a bigger (b) wave in yellow — as long as futures stay above 7250ES.
The update followed a specific stretch of price action: late-afternoon buying on June 9 pushed the market to the.618 retracement of what had been viewed as the initial wave 1 down, an overnight pullback that could be labeled a b-wave, and a rally into the morning high on June 10 that the author treated as the c-wave of wave 2 and ultimately labeled as a wave 2 high.
The stakes change at 7250ES. The analysis draws a clear demarcation: if the market holds above that region, the larger corrective count — a yellow (a)(b) shape or a broader wave 2 — stays viable; a decisive break below 7250ES would flip the map toward a different scenario, implying the market is already in the heart of a third wave down in the (c) wave and projecting prices below 7000ES into the (c) wave support box.
Put simply, the June 9–10 action both opened and narrowed possibilities. The late-afternoon rally on June 9 that reached the.618 retracement kept the corrective option alive by producing the right geometry for a two-leg recovery, while the overnight pullback and the morning surge fit the classic a–b–c corrective sequence. At the same time, those very same moves complicate confidence that wave 2 is finished: the structure does not resolve cleanly into a single unambiguous count.


That complication is the practical friction traders must wrestle with. The rally into the session highs can be counted as a five-wave advance — which would argue for more upside or at least a limited pullback — but it does not count well as a five-wave c-wave. In other words, the move wears two plausible technical faces at once, and which face the market proves to be will determine whether risk is contained or expanding.
The consequence is direct for position management. Holding the 7250ES region keeps the safer, corrective interpretation intact: traders can treat the move as a larger wave 2 that leaves the main downside thesis on hold. A breach of 7250ES, however, would validate the alternate path — a third wave down inside the (c) wave — and should shift risk expectations toward the sub-7000ES projection embedded in that structure.
This matters now because the analysis folded price action through June 10 into the count and set 7250ES as the dateable level that separates the two views. The numeric thresholds (.618 retracement, 7250ES, 7000ES) are not academic: they are the lines that change what traders should expect and where stop and target decisions are placed.
The unanswered, most consequential question after this update is binary and imminent: will price break below 7250ES and lock in the deeper third-wave trajectory, or will the market respect that level and keep the larger corrective (b) wave in play? That single outcome will reassign conviction — and capital — from one plan to the other.
For readers watching the S&P500, the practical path is straightforward. Monitor June 10’s labeled high and the 7250ES region closely; if futures slip under that region, prepare for a projection beneath 7000ES into the (c) wave support box. If the market stays above, the broader wave 2 / bigger (b) wave count remains the cleaner working view.