Seven of Bank of America's 10 bear market indicators have been triggered in recent months, and the bank told investors to take profits now before a potential pullback.
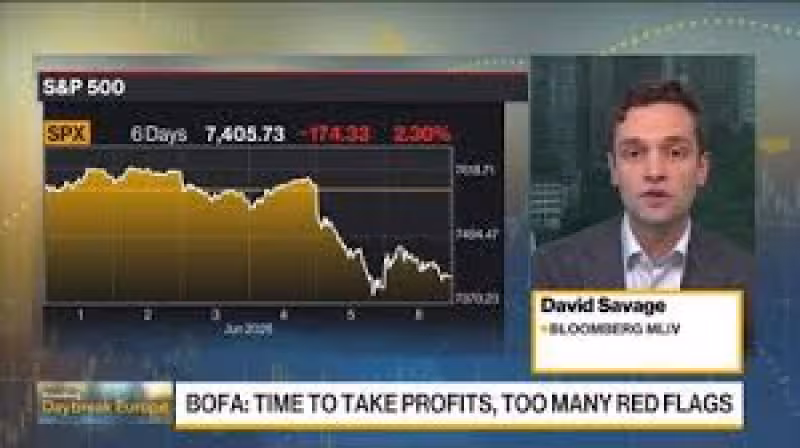
Five of those signposts had already tripped by April and two more flashed red in May, the strategists said, a cluster the team flagged as evidence the market could be approaching a top. The S&P 500 has returned 8% so far this year and traded at 7,400 points on Monday, while Savita Subramanian has set a year‑end target of 7,100 — a gap that underlies the firm's call for a more cautious stance.
In plain market news terms, the bank's signposts span sentiment, performance expectations and credit conditions: consumer confidence, forward stock performance expectations, credit stress and credit tightening sit among the indicators. One measure showed high price‑to‑earnings stocks leading low P/E names by a wide margin — a pattern the strategists described as a sign of excessive speculation — and they warned that lofty long‑term growth expectations have climbed past levels that make equities more vulnerable to disappointment.


The strategists also flagged valuation pressure across multiple lenses: the S&P 500 is “statistically expensive” on 17 of 20 metrics and trades rich versus tech‑bubble metrics on eight measures. Within technology, the dispersion between the best‑ and worst‑performing quintiles' median stock is the widest since February 2000, they wrote, even as overall tech fundamentals remain healthier than pre‑dot‑com levels; several measures, however, are deteriorating — cash‑flow conversion has flat‑lined, buybacks as a share of market cap have slowed, investment‑grade credit and equity supply have increased, and hyperscalers’ capital expenditures are expected to approach near 100% of operating cash flow by year‑end.
Bank of America’s team — led by Subramanian — said extreme price action may signal rising instability and that, while they “see opportunity in S&P 500 stocks, they do not see opportunity in the overall cap‑weighted index.” Put another way: a handful of large names are carrying the benchmark higher while broader measures look stretched, a dynamic that helps explain the warning even as the headline index is positive for the year.
The friction is stark: the S&P 500's 8% gain so far this year sits alongside seven triggered red flags. That contradiction is the core risk for investors weighing whether to lock in gains. The bank's advice to take profits is explicit; whether the indicators turn into an actual market correction is not answered by the strategists' note. For readers tracking the recent run higher, the S&P's climb and other market forces were covered earlier in Stock Market News Today: S&P 500 Extends Win as U.S.-Iran Talks Ease Oil Pressure, underscoring how macro headlines and valuation stress can move in different directions.
The most consequential unanswered question is straightforward: will the cluster of seven tripped indicators translate into a sustained pullback that tests Subramanian's 7,100 year‑end target, or will price action continue to outrun those warning lights? The strategists have given investors an explicit tactical instruction to harvest gains; the market must now show whether those signs of instability will force a reckoning or merely mark a noisy plateau.