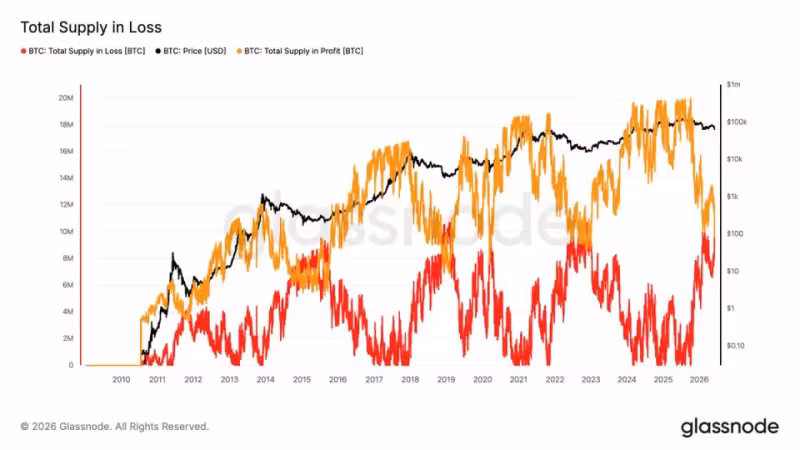
For the first time in this market cycle, more bitcoin was held at an unrealized loss than in profit: supply in loss peaked at about 10.5 million BTC on Thursday as the bitcoin price usd fell to as low as $61,300.
Measured at a one‑hour resolution, roughly 10.5 million BTC were in unrealized loss while supply in profit declined to around 9.8 million BTC, leaving a majority of the roughly 20 million BTC in circulation underwater on paper.
The immediate trigger for that crossover was the price touch of bitcoin’s 200‑week moving average, itself near $61,300. That long‑term average has acted as a meaningful technical support in prior downturns and gave this pause in price extra significance on the charts.
How the loss and profit buckets are calculated matters. Traders compare current price to the realized price — the average acquisition cost of all coins based on the price at which each coin last moved onchain — to determine whether holders sit in profit or loss. Bitcoin has historically traded below its Realized Price during every major bear market, which is the baseline analysts watch when gauging stress in holders’ positions.


The historical interpretation of this crossover is straightforward: past transitions where supply in loss exceeded supply in profit have appeared only during deep bear‑market conditions and have often lined up with major market bottoms. That pattern is why the threshold reached on Thursday is taken seriously by observers tracking market structure rather than short‑term volatility.
But that historical alignment comes with a large caveat. When the loss‑versus‑profit balance flipped in earlier cycles the time spent in that depressed state varied widely. In 2015 the market remained near equilibrium for almost a year before recovering; in 2019 the period lasted roughly six months; the Covid‑era capitulation in March 2020 was brief — about one month — and in 2022 the bear‑market condition persisted for roughly six months. Those examples underline that the indicator signals regime, not timing.
The practical map for traders is clear and simple: if bitcoin slips below $60,000 the next major support zone sits around $54,000. The $61,300 level matters now because it coincided with both the 200‑week moving average and the moment the loss bucket eclipsed the profit bucket. But touching that moving average and triggering the crossover does not itself predict whether the market will stabilize immediately or continue lower.
At the moment of the crossover the core facts are concrete: about 10.5 million BTC were in unrealized loss, roughly 9.8 million BTC were in profit, and the on‑chain centroid of price interest — the 200‑week average — was tested at roughly $61,300. Those are the data points investors can use to judge exposure and risk if they prefer structure over headlines.
The single unresolved question after Thursday’s move is duration. The indicator identifies that the market has entered a regime historically associated with deep drawdowns; it does not say whether that regime will last a month, six months, or close to a year. What comes next will be decided by price action around $60,000 and whether buyers defend the level or sellers drive the market toward the $54,000 support zone. Until that plays out, the crossover remains a historically meaningful signal without a fixed timetable.