


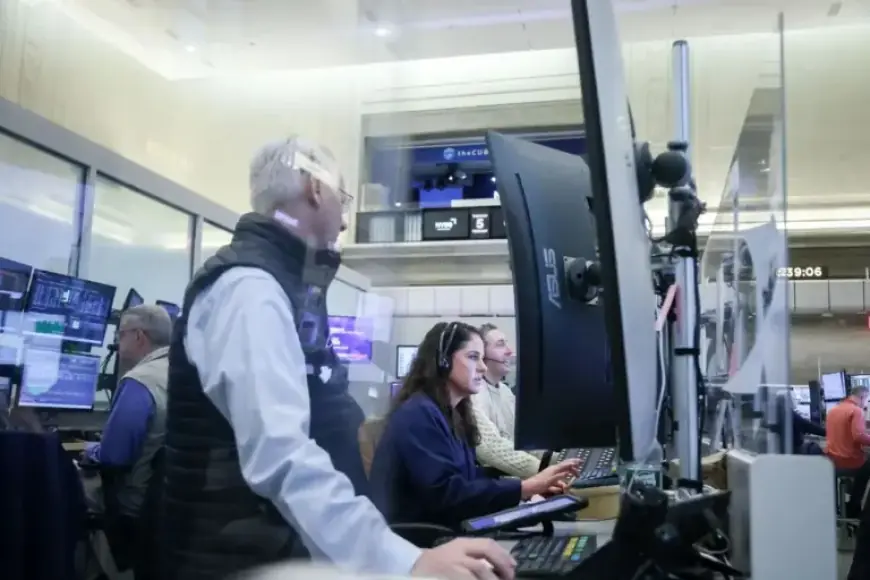
Stock Traders Analyze Charts for Market Direction Insights
The recent decline in tech stocks has raised concerns among investors. The S&P 500 Index is currently positioned just above a crucial technical trend line. Stock traders are closely analyzing charts to gain insights into potential market movements.
S&P 500 Faces Decline
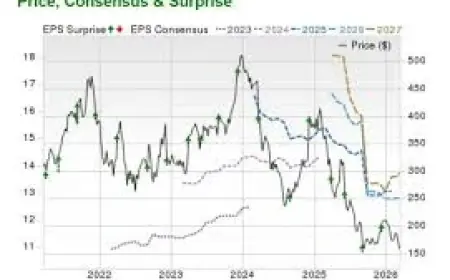
On Thursday, the S&P 500 Index closed at 6,798.40, reflecting a 1.2% decline. This drop has sparked worries related to the broader implications of artificial intelligence on the market. Market analysts are particularly focused on the index’s movement in relation to key support levels.
Key Technical Levels
For a significant period, the S&P 500 maintained its position above the 100-day moving average, previously set at 6,797. This moving average served as a reliable support line since May 2025. Analysts are now debating whether this support will hold amid ongoing volatility.
Market Sentiment
- Current S&P 500 index: 6,798.40
- Decline noted: 1.2%
- Critical moving average: 6,797
- Support level duration: since May 2025
As traders dissect market charts, they are trying to foresee how low the index could potentially go. Analysts assert that understanding these technical indicators is essential for making informed investment decisions.
Investors should remain vigilant as the situation unfolds, with chart analysis likely to provide valuable insights into future market direction. The emphasis on technical analysis is critical for navigating this turbulent economic landscape.