


Mortgage rates fall below 6% as mortgage average hits 5.76%
Market data shows the average 30-year fixed mortgage at 5. 76% as of Feb. 24, 2026 ET, marking another new low and pushing a growing number of lenders to offer sub-6% pricing. This move matters now because estimates show a 25-basis-point reduction near current levels could bring roughly 1. 42 million additional households into the market.
Mortgage averages and mortgage payment examples
The most recent national averages place the 30-year fixed at 5. 76% and the 15-year fixed at 5. 37%. Lenders with competitive offers are showing APRs as low as 5. 49%, and the number of lenders advertising mortgage rates under 6% is increasing.
To illustrate the effect on monthly payments: a $400, 000 mortgage at a 30-year term and a 5. 76% rate generates a principal-and-interest payment of about $2, 337 and results in roughly $441, 260 paid in interest over the life of the loan. By contrast, a $400, 000 15-year mortgage at 5. 36% would carry a monthly principal-and-interest payment near $3, 241 and total interest paid around $183, 345. Refinance rates are generally higher than purchase rates, and fixed-rate loans lock the rate in from day one; adjustable-rate products will adjust later by the rules in their contracts (for example, a 7/1 ARM holds its introductory rate for seven years, then adjusts annually).
Affordability impact of a 25-basis-point drop
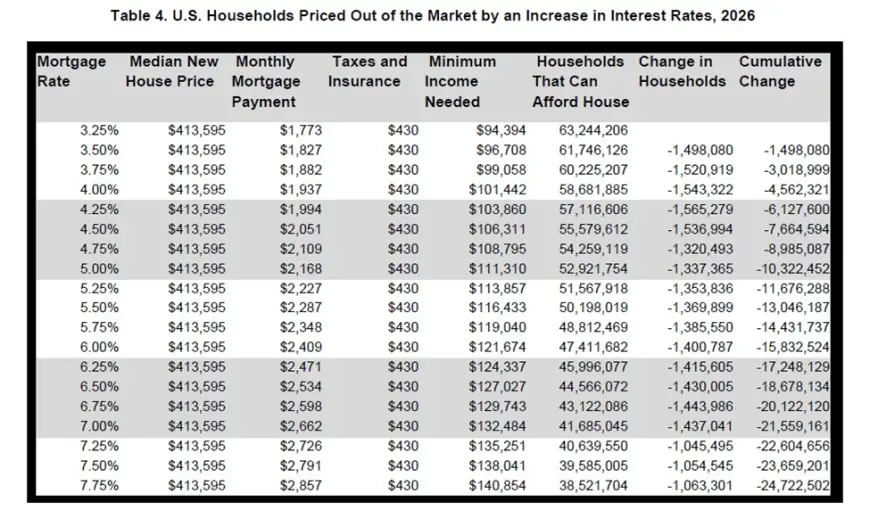
Estimates prepared for current market conditions show that at the start of 2026, with an average 30-year fixed rate near 6. 25%, about 31. 5 million households could afford a median-priced new home listed at $413, 595 under front-end underwriting standards that require a qualifying household income of $124, 336. A modest 25-basis-point decline from 6. 25% to 6. 00% would lower the qualifying income threshold enough to allow an estimated 1. 42 million additional households to afford that median-priced new home.
Context matters for the size of that effect: mortgage rates fell from a recent peak near 7. 6% in 2023 to roughly 6. 01% as of Feb. 19, 2026, and a 25-basis-point cut at higher rate levels produces a smaller affordability gain. For example, a drop from 7. 75% to 7. 50% is estimated to bring about 1 million households into qualification. Household income distribution amplifies these moves: roughly 79. 8 million households earn less than $105, 880, with an additional 14 million households earning between $105, 881 and $132, 350, so small shifts in the qualifying threshold intersect with densely populated income bands.
What to watch next
If the recent downward pressure on rates holds and more lenders publish sub-6% offers, the affordability gains outlined above could become more broadly available to prospective buyers. Conversely, if rates reverse upward, the incremental household additions tied to a 25-basis-point move would shrink. Observers tracking the housing market should watch lender pricing levels and the national 30-year average: the current 5. 76% figure (as of Feb. 24, 2026 ET) is a key reference point for potential buyers weighing purchase versus refinance decisions.
- Key takeaways: 30-year average 5. 76% (as of Feb. 24, 2026 ET); 15-year average 5. 37%.
- A 25-basis-point cut from 6. 25% to 6. 00% is estimated to add about 1. 42 million qualifying households for a median-priced new home at $413, 595.
- Example payments: $400, 000 at 5. 76% (30-year) ≈ $2, 337 monthly P&I; total interest ≈ $441, 260.
All figures cited are national averages and estimates rounded to the nearest hundredth where noted; some details are not publicly confirmed beyond the summarized market data and affordability estimates.