


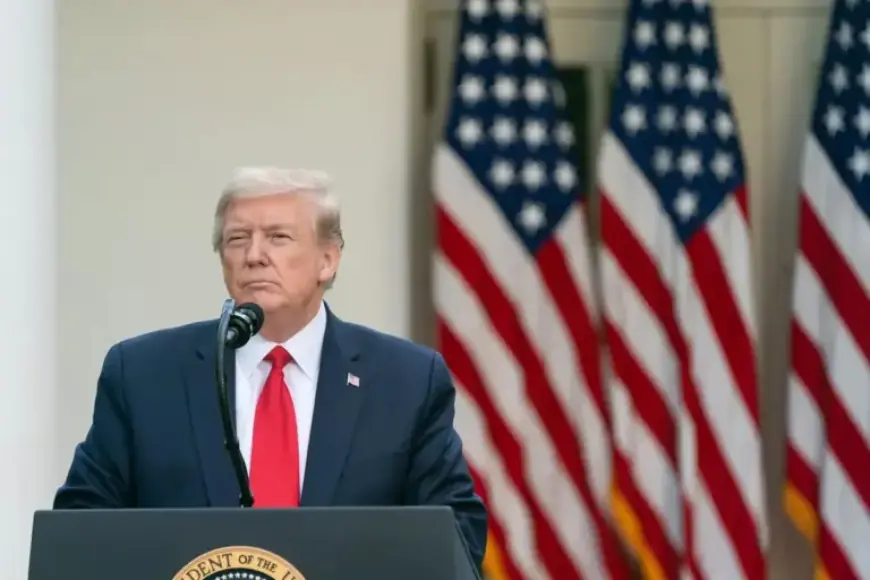
Wall Street Rattled by Trump’s Tariff News, Predicts Historical Market Trends
In January 2026, the S&P 500 index reached one of its highest historical valuations. However, analysis indicates that the index may be on the verge of a significant decline. Recent studies underscore that President Trump’s tariffs are adversely affecting both U.S. companies and consumers.
Impact of Tariffs on Economic Growth
President Trump has asserted that foreign companies will bear the burden of his tariffs. In a recent editorial, he claimed that these exporters pay “at least 80% of tariff costs.” However, a study he referenced from Harvard did not support this statement. Instead, it revealed that U.S. consumers are responsible for up to 43% of the tariff costs, with U.S. firms absorbing much of the remainder.
Further research from Goldman Sachs found that by October 2025, American companies and consumers had paid 84% of the total tariffs imposed. Projections suggest that by July 2026, consumers alone will shoulder 67% of these costs. An examination by the Kiel Institute of $4 trillion in shipments showed that only 4% of the tariff burden is absorbed by foreign exporters, with 96% passed to U.S. importers and consumers.
This dynamic effectively acts as a tax on consumption, diminishing consumer buying power and raising operational costs for businesses. Consumer spending and business investment account for about 85% of the U.S. GDP, making the implications of tariffs especially concerning for economic growth.
Market Indicators: S&P 500 Signals Concern
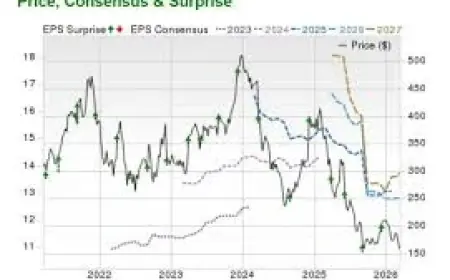
The S&P 500 recorded a cyclically adjusted price-to-earnings (CAPE) ratio of 39.9 in January 2026. This figure represents the fourth consecutive month above 39, a level not seen since the dot-com crash in October 2000. High CAPE ratios are generally viewed as indicators of overvaluation, suggesting poor future returns.
Historical S&P 500 Performance After High CAPE Ratios
| Time Period | Best Return | Worst Return | Average Return |
|---|---|---|---|
| Six months | 16% | (20%) | 0% |
| One year | 16% | (28%) | (4%) |
| Two years | 8% | (43%) | (20%) |
Historically, an S&P 500 CAPE ratio above 39 has led to a 0% average return in the following six months and an average decline of 4% within a year. Over two years, the average drop escalates to 20%.
Investment Strategy Moving Forward
Given the current market situation, characterized by high valuations and the negative impact of tariffs, investors should exercise caution. Although there may be reasons for optimism, such as anticipated growth from artificial intelligence driving earnings, prudent investment choices are advisable.
Investors are encouraged to evaluate their portfolios critically. Now could be a strategic moment to divest from stocks lacking strong conviction. Additionally, consider maintaining a cash position rather than fully committing new investments.
Long-term wealth creation should be the primary focus. The S&P 500 has historically delivered around 10.2% annual returns over the past three decades. There is no strong indication that future returns will deviate significantly from this trend.