


Superagonist Analgesic Targets µ-Opioid Receptor with Minimal Side Effects
Researchers performed an extensive preclinical evaluation of two nitazene-derived ligands, FNZ and DFNZ, across biochemical, structural, proteomic and behavioral assays. The work combined in vitro binding and kinetic measurements, cryo-electron microscopy, proximity proteomics, pharmacokinetic profiling and multiple rodent behavioral paradigms. Data collection used standardized workflows and commercial vendors where indicated.
Binding, kinetics and autoradiography
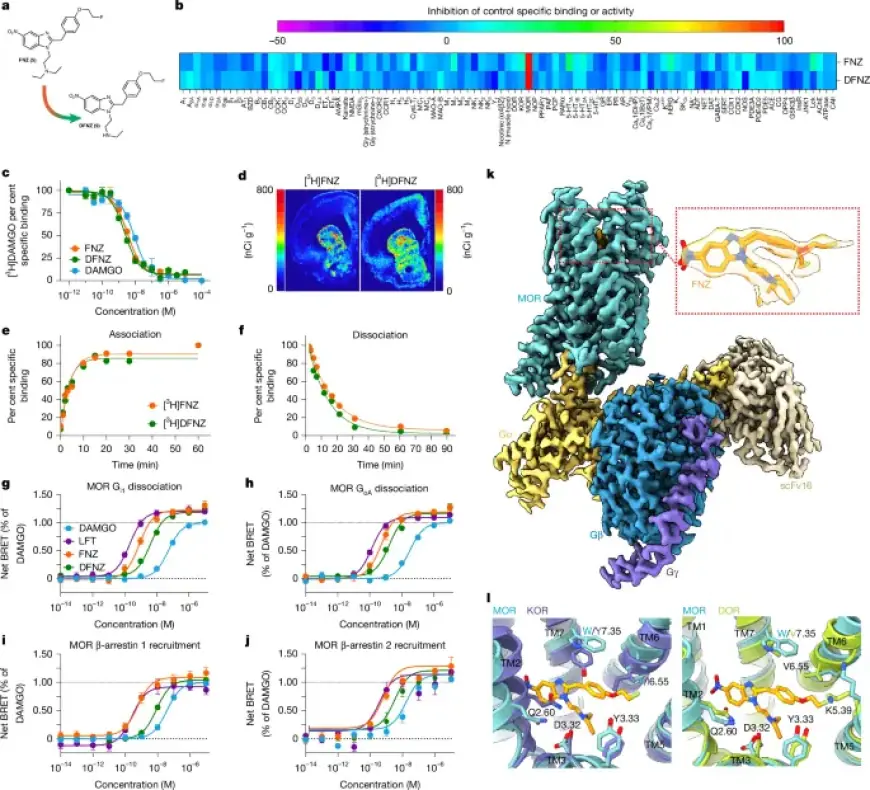
Commercial binding screens were run by Eurofins under contract with the NIH. Membrane homogenates were incubated with radioligands and tested with FNZ or DFNZ at 100 nM and 10 μM. Reference compounds ran concurrently to verify assay performance.
Competition binding used rat brain membranes (minus cerebellum) and [3H]DAMGO (~5 nM). Test concentrations ranged from 10 nM to 1 mM. Nonspecific binding was defined with 100 μM unlabelled DAMGO and Ki values calculated via the Cheng–Prusoff equation from three independent experiments.
Kinetic assays used human MOR membranes (Revvity ES-542-M400UA) with [3H]FNZ or [3H]DFNZ (~0.3 nM). Association and dissociation time courses covered 0–120 minutes. Data fitting yielded koff and dissociation half-life values using GraphPad Prism 10.
Autoradiography employed 20 μm frozen brain sections. Sections incubated with 4 nM [3H]FNZ or [3H]DFNZ included naloxone controls for nonspecific binding. Slides were exposed to phosphor screens and imaged with Typhoon systems after multi-day exposures.
Cellular signalling and BRET assays
BRET experiments measured G-protein dissociation and β-arrestin recruitment. Plasmids included Gα-RLuc8 constructs, Gβ and Gγ-GFP2, MOR constructs and β-arrestin–mVenus fusions. HEK293 or HEK293T cells were transfected by PEI and assayed after 48–72 hours.
G-protein activation was read as a decrease in BRET, while β-arrestin recruitment produced an increase. DAMGO served as the Emax reference. Kinetic BRET collected signals in 2-minute cycles from 2 to 46 minutes and used coelenterazine substrates depending on the assay.
Bias factors between Gαo and β-arrestin2 pathways were calculated using an Emax–EC50 proxy transduction index and normalized to DAMGO. Analyses used multiple independent experiments and GraphPad Prism 10.
Agonist-stimulated GTPγS autoradiography
Frozen rat brain sections underwent [35S]GTPγS autoradiography. Sections were incubated with GDP and DPCPX, then exposed to [35S]GTPγS cocktails containing FNZ, DFNZ or DAMGO at 10 μM. Radioactivity was quantified and expressed relative to basal binding.
Cryo-EM structure determination
Mouse MOR was solubilized and purified using detergents including LMNG and CHS, followed by Ni-NTA and M1 Flag affinity steps. Size-exclusion chromatography isolated monomeric receptor for complexation.
MOR was incubated with 100 μM FNZ prior to addition of purified Gi heterotrimer and scFv16. Apyrase was added and complexes were concentrated to ~10 mg/ml for cryo-EM grid preparation.
Grids were vitrified on ultrAufoil supports and imaged on a Titan Krios at 300 kV with a Gatan K3 detector. Data processing used MotionCorr2, CTFFIND4, Relion and CryoSPARC. Model building used prior MOR–Gi structures as starting models with Coot, Phenix and GlideEM validation.
Proximity proteomics and mass spectrometry
HEK293T cells expressing MOR–APEX2 and spatial reference APEX constructs were labelled with 500 μM biotin-phenol. Receptor activation used saturating DAMGO (10 μM), FNZ (100 nM) or DFNZ (100 nM) with time points at 0, 1, 5, 10 and 30 minutes.
Biotinylation was initiated by 1 mM H2O2 for 45 seconds and quenched. Streptavidin enrichment was automated on a KingFisher Flex and on-bead tryptic digestion followed. Peptides were analysed on a TimsTOF HT in dia-PASEF mode.
Data were processed with Spectronaut and MSstats. Proteins were considered significant interactors if the maximum log2 fold change exceeded log2(1.5) and ANOVA P ≤ 0.05. A panel of 650 location-specific proteins supported spatial coefficient calculations via repeated nonnegative least-squares runs.
In vitro ADME and transporter profiling
Microsomal stability assays used mouse liver microsomes and an NADPH regenerating system with 10 μM test compound. Samples were taken at 0, 30 and 60 minutes and analysed by LC–MS. Percentage remaining was calculated against t=0 samples.
Efflux transporter panels and substrate assessments were performed by Eurofins. Assays evaluated interactions with P-glycoprotein, BCRP and MATE1. Inhibition greater than 25% was flagged as significant. Caco-2 fluorescein permeability checks ensured monolayer integrity.
Plasma protein binding employed equilibrium dialysis with rat plasma spiked at 100 nM [3H]FNZ or [3H]DFNZ, incubated at 37 °C and measured by scintillation counting. Quantitative LC–MS methods used UHPLC coupled to Orbitrap instruments with validated calibration ranges.
In vivo imaging and radiochemistry
[18F]FNZ synthesis began from cyclotron-produced [18F]fluoride. The average starting activity was 68.9 GBq (n=6). The [18F]fluoroethyl tosylate intermediate yielded 58% (n=3).
Final radiochemical synthesis produced on average 98 mCi of [18F]fluoro-etonitazene per run. Total synthesis time averaged 67 minutes. Specific activity averaged 831.1 GBq μmol−1 and radiochemical purity was ~99.4%.
Dynamic PET scans in male rats used intravenous [18F]FNZ (~0.2 μg kg−1) over 90 minutes on a Mediso nanoScan PET/CT. Some animals received naltrexone pretreatment. Data were reconstructed and analysed with PMOD, reporting SUVs and region/cerebellum ratios.
Animal cohorts, behavioural assays and neural recordings
Animals included Sprague Dawley rats, C57BL/6J mice, TH-Cre mice bred at NIDA, Oprm1-knockout mice (Jackson Laboratory strain 007559) and PGP/BCRP-knockout mice from Taconic. Ages ranged from 6 to 12 weeks depending on strain. Housing conditions matched standardized temperature, humidity and reverse light cycles.
All procedures complied with NIH regulations and were approved by IACUCs at NIDA, Boston University and the University of Barcelona. Animals were randomly assigned and experimenters were blinded when applicable.
Locomotion, analgesia and side-effect profiling
Locomotor activity used Opto-varimex arenas. Wild-type mice were tested in cohorts of 12 per drug (6 male, 6 female). Oprm1-knockout cohorts included 8 mice per drug (4 male, 4 female). Drugs and dose ranges included morphine, FNZ (1–300 μg kg−1 ip) and DFNZ (0.03–10 mg kg−1 ip). Sessions lasted 60 minutes.
Analgesia and adverse endpoints were measured in male rats (n=5 per dose group). FNZ was dosed at 1–30 μg kg−1 sc. DFNZ was dosed at 0.1–3 mg kg−1 sc. Catalepsy, body temperature and hot plate latency were recorded at multiple post-dose time points. Data were normalized to percent maximum possible effect for ED50 estimates.
Antinociceptive models in mice
Hot plate testing in Oprm1-knockout mice used FNZ (0.1 mg kg−1) and DFNZ (3 mg kg−1) administered subcutaneously. Measurements were taken up to 60 minutes post injection with a 20 s cut-off at 54 °C. Complete Freund’s adjuvant, von Frey and Hargreaves assays evaluated inflammatory pain models.
Self-administration and reward-related assays
Rats were implanted with jugular catheters for intravenous self-administration training. Training used heroin (100 μg kg−1), FNZ (1 μg kg−1), or DFNZ (30 μg kg−1) under FR schedules. Dose–response, extinction and reinstatement protocols assessed drug-seeking and intake. Separate tests evaluated effects on food pellet self-administration.
Neural signalling and microdialysis
Dopamine dynamics were recorded with dLight1.3b in the nucleus accumbens. Viral injections used stereotaxic coordinates and 500 nl volumes. Fibre photometry recorded biosensor signals before and after subcutaneous drug administration over 30 minutes.
Axon-targeted GCaMP6s recordings used TH-Cre mice with VTA injections and NAc fibre implants. Signals were analysed for transient and slow changes using dF/F metrics. Microdialysis in VTA used ACSF at 1.25 μl min−1 with dialysate collection every 20 minutes and dopamine quantitation by HPLC.
Oxygen monitoring, tolerance and withdrawal
Oxygen sensors implanted in NAc measured opioid-induced brain hypoxia with high temporal resolution. Doses tested included FNZ, DFNZ and fentanyl. Tariquidar pretreatment was evaluated for transporter-related effects.
Tolerance protocols applied escalating daily doses over four weeks. von Frey assays assessed mechanical sensitivity for tolerance and delayed hypersensitivity. Naloxone-precipitated withdrawal used escalating morphine schedules or twice-daily FNZ/DFNZ regimens, followed by 1 mg kg−1 naloxone to score somatic signs.
Cellular engagement assays and statistics
NanoBiT complementation assays paired MOR-SmBiT with Gαo-LgBiT in HEK293T cells. Compounds were tested against MOR engagement and luminescence measured after coelenterazine H addition. Data were expressed relative to MOR-only luminescence controls.
All quantitative analyses used GraphPad Prism 10. Statistical approaches included one- and two-way ANOVAs, mixed-effects models, t-tests and nonparametric tests as appropriate. Replicate numbers, randomization and blinding were applied to support reproducibility.
The dataset integrates biochemical, structural, proteomic and behavioral evidence on FNZ and DFNZ. The work explores how a superagonist analgesic targets µ-opioid receptor with minimal side effects in controlled preclinical settings. Filmogaz.com compiled this summary from the reported methods and experimental details.