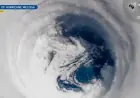


Weather radar becomes the make-or-break tool as Winter Storm Fern blurs the forecast line
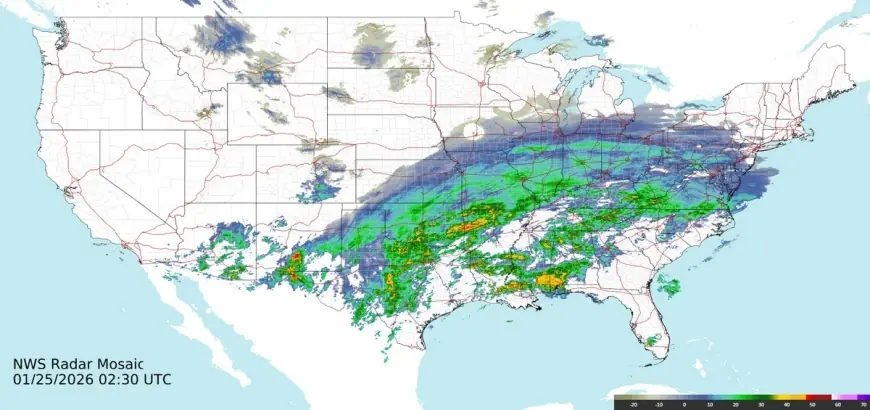
In the past day, Winter Storm Fern has turned weather radar from a background map into the deciding factor for travel, school closures, and power-crew staging across a wide slice of the U.S. The storm’s messy mix—snow, sleet, freezing rain, and plain rain stacked in tight bands—makes standard “chance of precipitation” forecasts feel vague. Radar updates, especially when animated and paired with temperature profiles, are delivering the real-time truth people are acting on: where roads will glaze, where plows will keep up, and where a quick changeover can flip a routine commute into a stranded one.
The uncertainty isn’t the storm—it's the transitions radar is trying to pin down
Winter storms don’t usually fail forecasts because meteorologists missed the existence of the system. They fail in the margins: the narrow corridors where precipitation type changes block by block, and the timing windows where a few hours determine whether you get wet pavement, compacted snow, or ice that won’t melt all day.
That’s why radar matters most during storms like Fern. The key question isn’t “Will it precipitate?” but:
-
When does snow turn to sleet, then freezing rain, then rain—and back again?
-
How far inland does the warm layer push before cold air undercuts it again?
-
Do bands stall over one metro area long enough to overwhelm treatment and plowing?
Radar can reveal those answers, but it also has blind spots that become more obvious in winter. “Pink” or “mixed” shading on a radar map can be shorthand for complicated physics—sometimes it’s sleet, sometimes it’s melting snowflakes, sometimes it’s a radar artifact from the melting layer aloft. In other words: radar is indispensable, and still imperfect.
A second complication is that people increasingly consume radar through consumer apps that smooth, re-color, and “future-cast” the imagery. During a high-impact winter event, those convenience layers can create false confidence—especially when the storm is evolving faster than the app’s update cycle.
What’s happening with Winter Storm Fern, and why radar is in the driver’s seat
Fern has unfolded as a sprawling system with significant winter weather threats from the southern U.S. into parts of the Midwest and Northeast, with disruptive travel conditions and icing risk in multiple corridors. The practical problem has been the storm’s multi-phase behavior: a warm surge aloft can flip snow to ice, while near-surface cold air lingers and turns rain into glaze. Those are the situations where radar and surface observations have the most value—and where small shifts create big consequences.
Radar signatures forecasters and emergency planners lean on during storms like this include:
-
Banding structures: narrow, intense arcs of precipitation that can dump snow quickly or lay down bursts of sleet that are hard to clear.
-
Dry slots: wedges of reduced precipitation that can briefly ease conditions—then set up a sharp back edge with rapid refreeze.
-
Precipitation type inference: not a direct “snow vs. ice” reading, but patterns that, combined with temperature profiles, help identify where icing is most likely.
For the public, the biggest day-to-day impact has been decision timing. A radar loop that shows the heavier band arriving two hours earlier can push schools to close, airlines to preemptively cancel, and utilities to reposition crews. A loop showing a changeover line wobbling north or south by 20 miles can separate “slushy but passable” from “skating rink.”
Mini timeline: how radar-guided decisions typically shift during a storm like Fern
-
Pre-storm (24–48 hours out): Planning leans on model guidance; radar is mostly used to track the storm’s upstream organization.
-
Morning of onset: Radar confirms whether the leading edge is arriving early, and whether the initial burst is heavier than expected.
-
Mid-event: The focus shifts to transition lines—where snow changes to sleet/freezing rain—and whether heavier bands are training over the same areas.
-
Late event: Radar helps pinpoint the back edge and identify where clearing skies could trigger a rapid refreeze.
-
Next 12–24 hours: The most telling signal is whether lingering wraparound bands persist longer than expected, extending hazardous conditions into the recovery window.
The “Weather Underground” problem: why forecasts look different depending on where you check
Many people noticed during Fern that forecasts and radar visuals can diverge depending on the product they use—especially services that blend national radar feeds with crowdsourced observations and personal weather stations. The differences are often real, but they don’t always mean one forecast is “wrong.” They can reflect:
-
Different update cadence: A lag of even 10–15 minutes matters when a heavy band is moving in.
-
Different smoothing or interpolation: Some displays soften sharp gradients, making a transition zone look broader or calmer than it is.
-
Different nowcast techniques: Short-term “future radar” projections can struggle when precipitation is reorganizing, intensifying, or changing type.
The best approach during a winter storm isn’t to hop between apps until one feels reassuring. It’s to compare radar motion with temperature and alerts, then make decisions based on the worst credible outcome in your immediate area—especially when freezing rain is on the table.
Fern is a reminder that the most important weather information often isn’t a single forecast number. It’s the real-time evolution radar shows—paired with an honest understanding of what radar can’t directly prove in winter.