


Winter Storm Snowfall Totals: Where the Snow Hit Hardest and What Comes Next After the Freeze
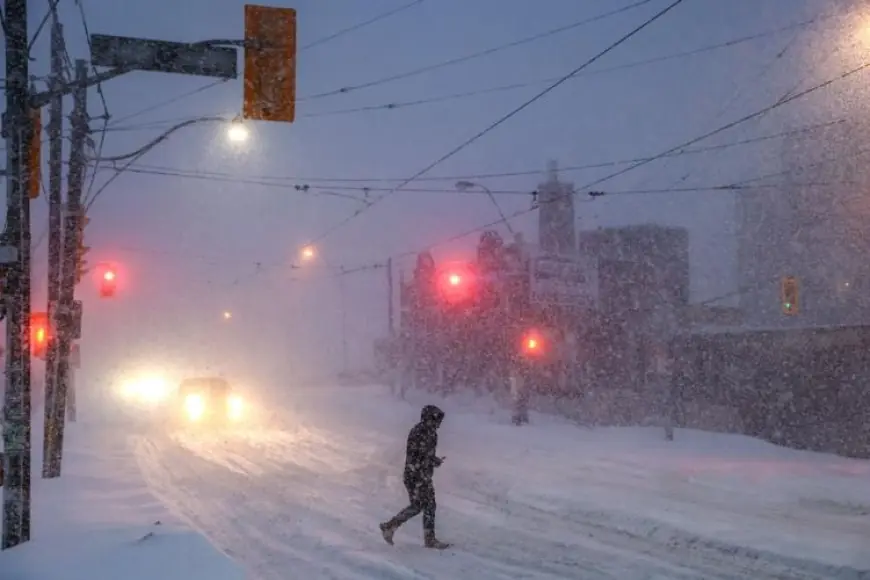
A sprawling winter storm has pushed snow, sleet, and ice from the Southern Plains through the Midwest and into the Northeast, delivering some of the most disruptive winter weather in years for many cities. As of the morning of January 26, 2026 (ET), preliminary storm reports and airport observations show a wide spread of snowfall totals—while many places in the South saw more ice and sleet than classic “fluffy snow,” the Mid-Atlantic and parts of the Northeast piled up double-digit inches.
Below is a roundup of notable snowfall totals reported through the morning of January 26, 2026 (ET). Totals can still change as late reports come in and as compaction, drifting, and measurement timing get reconciled.
Snowfall totals so far: standout numbers by region (through Jan. 26 morning ET)
Northeast and Mid-Atlantic
-
New Bethlehem, Pennsylvania: 23 inches (one of the highest totals east of the Rockies in this event)
-
Boston (Logan Airport): 16.7 inches
-
New York City (Central Park): 11.4 inches
-
Baltimore (BWI area): 11.3 inches
-
Pittsburgh: 11.2 inches
-
Washington, D.C. area: 7.8 inches (Dulles) and 6.9 inches (Reagan National)
Midwest
-
Indianapolis (airport): 11.1 inches
-
Cincinnati: 10.2 inches
-
St. Louis: 8.2 inches
-
Tulsa: 8.7 inches
-
Oklahoma City: 8.5 inches
-
Cleveland: 7.6 inches
-
Kansas City: 5.2 inches
-
Chicago: 4.4 inches (O’Hare), with higher localized totals reported in parts of the city
South and Southern Plains (snow + sleet mix in many spots)
-
Lubbock: 6.8 inches
-
Little Rock: 6.7 inches
-
Louisville: 5.9 inches
-
Memphis: 3.6 inches (snow and sleet combined)
-
Dallas–Fort Worth area: 2.4 inches (snow and sleet combined)
-
Midland, Texas: 2.8 inches (with nearby higher totals reported in the region)
Canada highlight from this storm’s northern reach
-
Toronto: 22 inches (reported as a major single-event benchmark for the city)
Austin and Central Texas: why your “snow total” may be small even if travel is dangerous
For the Austin area, the bigger headline has often been ice and packed sleet, not deep snow. In nearby communities north of Austin, ice accumulation around one-half inch has been reported—enough to make untreated roads treacherous even when snowfall totals look unimpressive on paper. That’s why “snow totals” can feel disconnected from what you see outside: sleet compacts into a hard crust, refreezes overnight, and behaves like a thin skating rink.
Behind the headline: why totals vary so wildly from city to city
This storm’s footprint is a case study in how temperature layers decide outcomes. A few degrees of difference aloft can flip precipitation from snow to sleet to freezing rain. That matters because:
-
Snow totals are not the full impact story. Two inches of snow can be manageable; a glaze of ice can shut down a city.
-
Sleet “steals” what would have been snow depth. It compacts quickly, so reported “snowfall” can look low while roads are still hazardous.
-
Banding creates jackpot zones. Narrow snow bands can dump 3–6 inches more than areas a few miles away.
The incentives are also real: officials focus on road danger and power risk rather than snow depth, because those are what drive injuries, crashes, and outages.
What we still don’t know (and what could revise totals)
Even with many reports in, some uncertainty remains:
-
Late-arriving measurements from smaller towns and rural areas
-
How much drifting inflated totals in exposed locations
-
Whether some official totals are “storm total snowfall” versus “snow + sleet”
-
How refreeze and compaction change what people perceive on the ground
What happens next: the most likely 24–48 hour scenarios (ET)
-
Improving visibility, lingering slick surfaces: Even as skies clear, shaded roads and bridges can stay icy into January 26 afternoon (ET).
-
Overnight refreeze: Any daytime melting can re-freeze after sunset, making early January 27 (ET) commutes risky.
-
Cleanup phase + backlog: Delayed flights, deliveries, and school decisions can ripple for another day even where snow has stopped.
-
Secondary hazards: Burst pipes, fallen branches, and strained infrastructure often peak after precipitation ends—when the deepest cold settles in.
Snow totals are the easiest number to search, but the true impact is a mix of snow depth, sleet compaction, ice glaze, wind, and how long temperatures stay below freezing. If you tell me your city or ZIP code, I can narrow this to the most relevant local storm-total range and what that means for travel today (ET).