


Generalist LLM Chatbot Accessible for Public Health Inquiries
A large dataset of conversations labeled as Health and Fitness was analyzed. The final sample contained 617,827 conversations after initial exclusion steps.
Most entries included platform and time information. Specifically, 99.1% had a known platform for mobile-versus-desktop analysis. A further 99.6% had valid timestamps for temporal analysis.
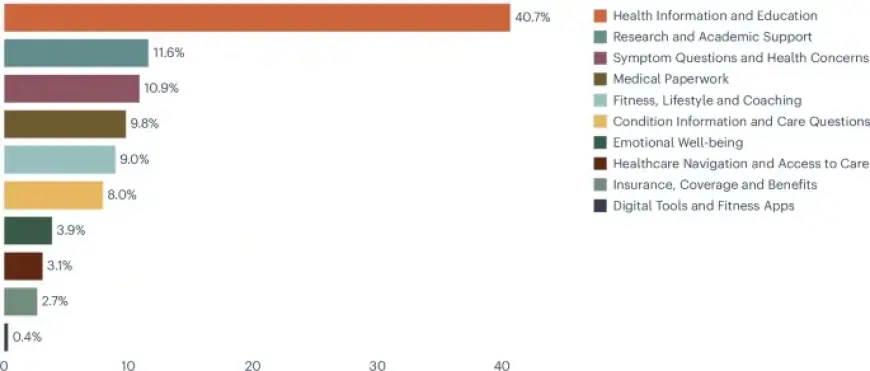
Overall intent mix
The single largest intent category was Health Information and Education. It represented 40.8% of conversations (95% CI 40.7–40.9).
Topic clustering showed many queries focused on specific treatments and conditions. This suggests some general-seeming queries may reflect personal health decision-making.
Platform differences
The category Digital Tools and Fitness Apps was removed from platform and temporal analyses. Manual review showed many of those were technical support requests for wearables.
Intent distributions varied substantially by device. A chi-square test found χ2(8, N = 612,330) = 73,981.6, P < 0.001.
- On mobile, Symptom Questions and Health Concerns were 15.9% (95% CI 15.8–16.0).
- On desktop, that same intent was 6.9% (95% CI 6.8–7.0).
- Emotional Well-being was 5.1% on mobile (95% CI 5.0–5.1).
- Emotional Well-being was 3.0% on desktop (95% CI 2.9–3.0).
- Research and Academic Support reached 16.9% on desktop (95% CI 16.8–17.1).
- Research and Academic Support was 5.3% on mobile (95% CI 5.2–5.3).
- Medical Paperwork was 15.7% on desktop (95% CI 15.6–15.8).
- Medical Paperwork was 2.7% on mobile (95% CI 2.7–2.8).
Daily device rhythms
Desktop use was more common during daytime hours. Mobile queries predominated in the evening and at night.
The desktop pattern showed rises in research and paperwork during work hours. This suggests many desktop health queries are adjacent to professional or academic tasks.
By contrast, mobile sessions skewed toward personal health concerns. Symptom questions and condition queries were more frequent on phones.
Temporal shifts in intent
Intent shares changed across the day. Personal topics increased later in the day and at night, while scholarly topics decreased.
Emotional Well-being rose from 3.3% in the morning (6:00–12:00) to 5.2% at night (00:00–6:00). The change was significant (χ2(23, N = 613,026) = 903.3, P < 0.001).
Symptom Questions and Health Concerns grew from 10.6% in the morning to 13.4% at night. This shift was also significant (χ2(23, N = 613,026) = 1,445.8, P < 0.001).
Who the queries concern
A subsample of 2,165 conversations was annotated for the person the query concerned. Conversations about pets and animals were excluded.
Most personal-intent queries were for the user themself. However, a notable share concerned dependents.
- Symptom Questions: 14.5% concerned a dependent (95% CI 12.4–16.8).
- Condition Information and Care Questions: 14.9% concerned a dependent (95% CI 12.6–17.6).
- Emotional Well-being: 7.6% concerned a dependent (95% CI 5.4–10.5).
Topical concentration and exclusions
Extended topic tables showed the Health Information and Education category centered on treatments and conditions. Broad health education was less dominant than expected.
Categories such as Coverage and Benefits, Research and Academic Support, Medical Paperwork, and Digital Tools and Fitness Apps mostly reflected professional or administrative use. They were therefore excluded from topic-level consumer analysis.
Implications for design
These patterns matter for designers of conversational systems. A generalist LLM should tailor responses to device and time signals.
Designers should consider how a chatbot can be accessible for public health inquiries across contexts. Copilot-style usage on desktop often accompanies document workflows. Mobile use tends to involve immediate personal concerns.
Filmogaz.com reports these findings to inform future public-health oriented conversational tools. The data highlight distinct needs across platforms and hours.