


Reliance Power Ltd Trades Surge with Mixed Technical Indicators
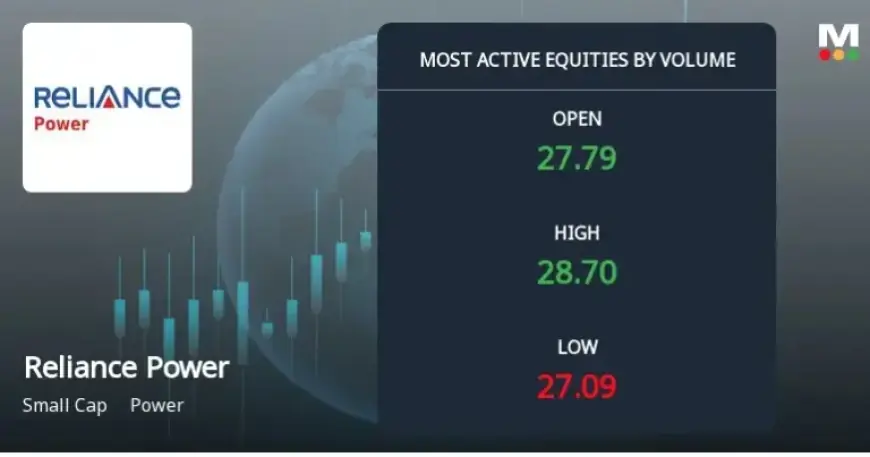
On January 30, 2026, Reliance Power Ltd experienced a significant trading surge. The company recorded a total traded volume of 22,052,556 shares, reflecting a traded value of around ₹61.7 crores. The stock opened at ₹27.77, unchanged from the previous close. It reached an intraday high of ₹28.70 before settling at ₹28.48 by 10:39 AM IST, indicating a 1.94% increase from the prior session. This performance is notable, especially as it outperformed the Power sector, which declined by 0.41%, and the Sensex, which fell by 0.48% on the same day.
Technical Indicators and Market Sentiment
Despite the positive price action, Reliance Power’s stock trades below key moving averages, such as the 5-day, 20-day, 50-day, 100-day, and 200-day averages. This suggests that the stock is still within a longer-term downtrend, indicating caution for investors.
Investor Participation and Liquidity
Investor engagement has notably increased. On January 29, the delivery volume rose by 3.24% from the five-day average. The stock supports trade sizes up to ₹3.31 crores, based on 2% of the five-day average traded value. This increase in delivery volume is a sign of genuine accumulation rather than speculative trading.
- Delivery volume increase indicates commitment from investors.
- Sufficient liquidity enhances accessibility for both institutional and retail investors.
Mojo Score and Market Review
Reliance Power’s mojo score stands at 34.0, categorized as a ‘Sell’ grade. This reflects an improvement from the ‘Strong Sell’ rating it received on November 3, 2025. While this upgrade indicates a slight easing of negative sentiment, caution is still advised.
The company’s market capitalization is approximately ₹11,473 crores. Being classified as a small-cap stock, it inherently carries risks associated with volatility and scale.
Accumulation Trends
The surge in traded volume and price increase suggests accumulation by investors. However, the stock’s position below major moving averages tempers enthusiasm. The increase in delivery volume signifies that a large proportion of shares are being held by investors, which is a favorable sign for medium-term prospects.
Sector Comparison and Performance
Within the Power sector, Reliance Power outperformed its peers by 2.67% on January 30. Recently, this sector has faced challenges due to regulatory uncertainty and fluctuating fuel prices. Reliance Power’s modest outperformance may signal unique company developments or increased speculative interest fueled by its volume and liquidity profile.
Investment Outlook
Investors should remain cautious as they analyze Reliance Power. Although the stock saw a volume surge, it continues to trade below all major moving averages, maintaining its larger downtrend. The improvement from a ‘Strong Sell’ to ‘Sell’ signifies a cautious optimism, but the overall sentiment remains bearish.
In light of the small-cap status and the challenging sector environment, potential investors may prefer to wait for more evidence of a sustained uptrend before committing significant capital. Monitoring volume trends along with price actions will be essential to determine if the current accumulation is ongoing or merely a temporary spike.
Summary
Reliance Power Ltd’s trading activity on January 30, 2026, underscores a renewed interest from investors amidst a challenging environment. Despite outperforming peers and the Sensex, technical indicators remain bearish. The increase in delivery volume suggests potential accumulation, but investors should exercise prudence due to the stock’s inherent risks and overall market conditions.