


Eversource Outage Map Sees Heavy Traffic as Blizzard Recovery Continues Across New England
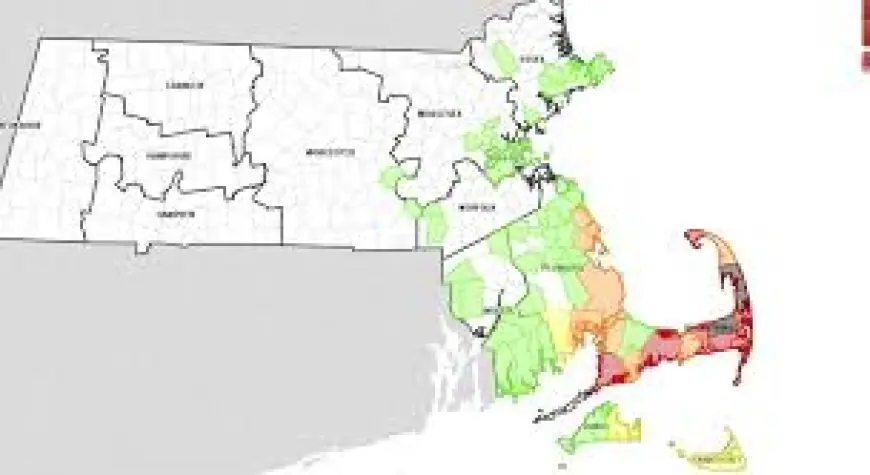
The Eversource outage map is seeing a surge in checks and refreshes across Connecticut, Massachusetts, and New Hampshire as communities move from storm response to restoration and cleanup. In the wake of the late-February blizzard that peaked Monday, February 23, 2026, customers have relied on the Eversource outage map to track neighborhood-level repairs, estimated restoration times, and the changing footprint of outages driven by downed trees, damaged lines, and difficult travel conditions.
While many areas have returned to normal service, pockets of outages have persisted in harder-hit coastal and wooded sections where access and damage assessments take longer. The Eversource outage map has become the main way for customers to confirm whether their address is part of a larger circuit issue, a localized line problem, or a single-service repair.
Eversource Outage Map: What It Shows and What It Doesn’t
The Eversource outage map typically displays outage counts by service area, clusters of impacted neighborhoods, and a closer view that can show outage start times, status, and restoration estimates when available. During major storms, the map can change rapidly as crews restore larger feeder lines first, then move into smaller neighborhood lines and individual service connections.
What the Eversource outage map may not show in real time is the full complexity behind each dot or cluster. A single “outage” label can represent anything from a small equipment issue affecting a handful of homes to a larger upstream problem that leaves multiple streets dark. Map totals can also shift when a larger circuit is partially restored or when additional damage is discovered during field work.
Why Customers Are Checking the Eversource Outage Map More Often This Week
The February blizzard delivered heavy snow and strong wind gusts that increased the likelihood of tree limbs snapping onto lines and poles. In many towns, restoration progress has been steady, but the final stretch often takes the longest because it involves isolated repairs, difficult terrain, or private-property access.
That dynamic has pushed more people to repeatedly search the Eversource outage map for three practical reasons:
-
Confirming whether an outage is widespread or limited to their immediate block
-
Watching for estimated restoration times to appear, change, or disappear as assessments evolve
-
Verifying that a restoration is stable after power returns, especially during refreezing and cleanup
Customers in coastal and heavily wooded areas have been among the most frequent users, reflecting where snow load, wind exposure, and tree density can compound storm damage.
How to Use the Eversource Outage Map to Get the Most Accurate Read
For customers trying to make decisions about heating, food safety, and travel, using the Eversource outage map effectively can reduce guesswork. The most useful approach is to combine the map’s address-level view with outage alerts and a direct outage report if your home is dark but your immediate neighbors appear to have service.
Here is a quick guide to getting the most value from the Eversource outage map:
| What You Need | Best Map Action | Why It Helps |
|---|---|---|
| Confirm if your outage is known | Search by address/area and zoom in | Determines whether it’s already tracked |
| See restoration timing | Look for an estimated restoration time field | Helps plan for heat, charging, and shelter |
| Track progress | Note outage counts over time in your region | Shows whether repairs are moving closer |
| Spot repeat interruptions | Recheck after restoration | Identifies if a circuit is unstable |
If the Eversource outage map shows no outage near you but your home is out, filing an outage report can help flag a localized issue such as a service drop or a street-level fuse problem.
Restoration Priorities and Why Some Areas Return Faster Than Others
Restoration typically follows a practical sequence: repairs that bring back the most customers first, then critical infrastructure, followed by neighborhood lines and individual service connections. This is why a town can appear “mostly restored” while a few streets remain dark for hours longer.
Common reasons for slower restoration include:
-
Multiple damage points on the same circuit requiring separate repairs
-
Road access limitations from drifting snow, fallen branches, or blocked side streets
-
Repairs that require specialized equipment or coordination for safety clearances
-
Isolated pockets where only a small number of customers are affected
These factors can cause estimated restoration times on the Eversource outage map to shift, especially when crews uncover additional damage after power is restored to part of a circuit.
What to Watch Next on the Eversource Outage Map Through Thursday Night
Through Thursday, February 26, 2026 (ET), the most important signals on the Eversource outage map are shrinking clusters, fewer repeat outages, and a tapering number of customers without service in the remaining hotspots. Customers should also watch for new outages triggered by cleanup activity, such as tree removal, vehicle accidents near poles, or shifting snow loads.
For households still without power late Thursday, the map’s local details—where available—can help set expectations for whether the remaining work is a neighborhood line repair or an individual service restoration. As the footprint contracts, the Eversource outage map becomes less about broad storm totals and more about confirming that the last mile of repairs is underway and stable.